
…are active members of Access Accountancy and were ranked 1st in the Social Mobility Foundation’s inaugural Employer Index in 2017. Grant Thornton not only provide young people with exposure to…

Poorer pupils get less homework help
…from a random sample of schools, and self-completion questionnaires were completed at school between 6th February and 17th May 2017. Data are weighted by school year, sex and region to…

Academy Advancement?
…delivering excellent outcomes for their pupils, substantially outstripping the averages above, there continue to be many chains who perform very poorly. When ranked on a composite index combining multiple performance…

Chain Effects 2017 press release
…the pupil premium. Chain Effects 2017 includes an index comparing the chains’ 2016 performance for disadvantaged pupils on the most important attainment measures, including Progress 8, Attainment 8 and the…

Five years’ time?
…the years for which we have data, privately educated MPs still account for 29% of parliament, despite only comprising 7% of the population. Parliament is not unique in this regard…
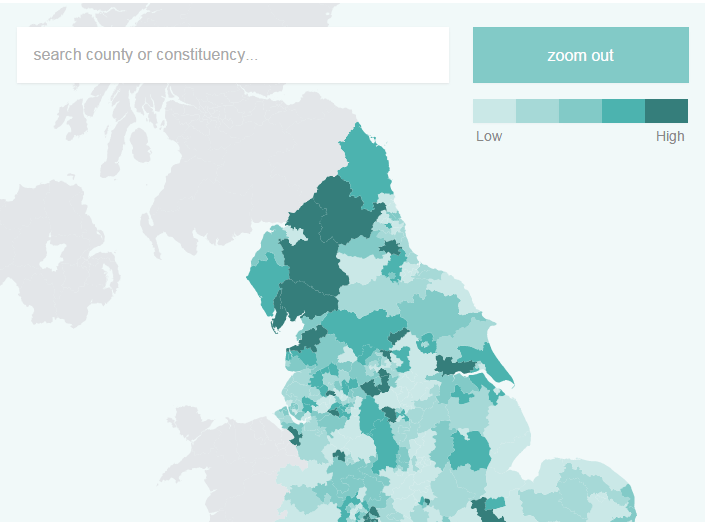
Poor children less likely to succeed in affluent areas
…Foundation, said: “The commission’s index paints a bleak picture of social mobility in some parts of the UK and confirms our own research that shows that the life chances of…