Opinion
Understanding social mobility
08 Jul 2025
Lee Elliot Major on more startling evidence on widening attainment gaps as children get older.
I had the privilege of speaking to a packed lecture theatre at the London School of Economics last week. I was asked to respond to the findings of the most powerful international study yet on education inequality in the early years. Columbia University’s Professor Jane Waldfogel delivered a fascinating lecture on how achievement gaps grow – from a book co-authored with fellow star academics Liz Washbrook, Miles Corak and Bruce Bradbury.
Too many children left behind tells a compelling and troubling story of the life trajectories of young children growing up in the United States, United Kingdom, Australia and Canada. The Anglophone countries all face a stark challenge: during their fledging lives children from lowly educated parents fall increasingly behind in cognitive tests compared with their peers from highly educated homes.
Up to 70% of achievement gaps at age 14 are already present when children first turn up for school at age five. But the book’s main message is that we need to help poorer children throughout their lives – before and during their school years.
The reason for this comes from a startling graph charting the progress of children from different social backgrounds with identical initial test scores at age five. This is similar to the famous Feinstein graph, but deploying very clever techniques to ensure the findings are statistically robust.
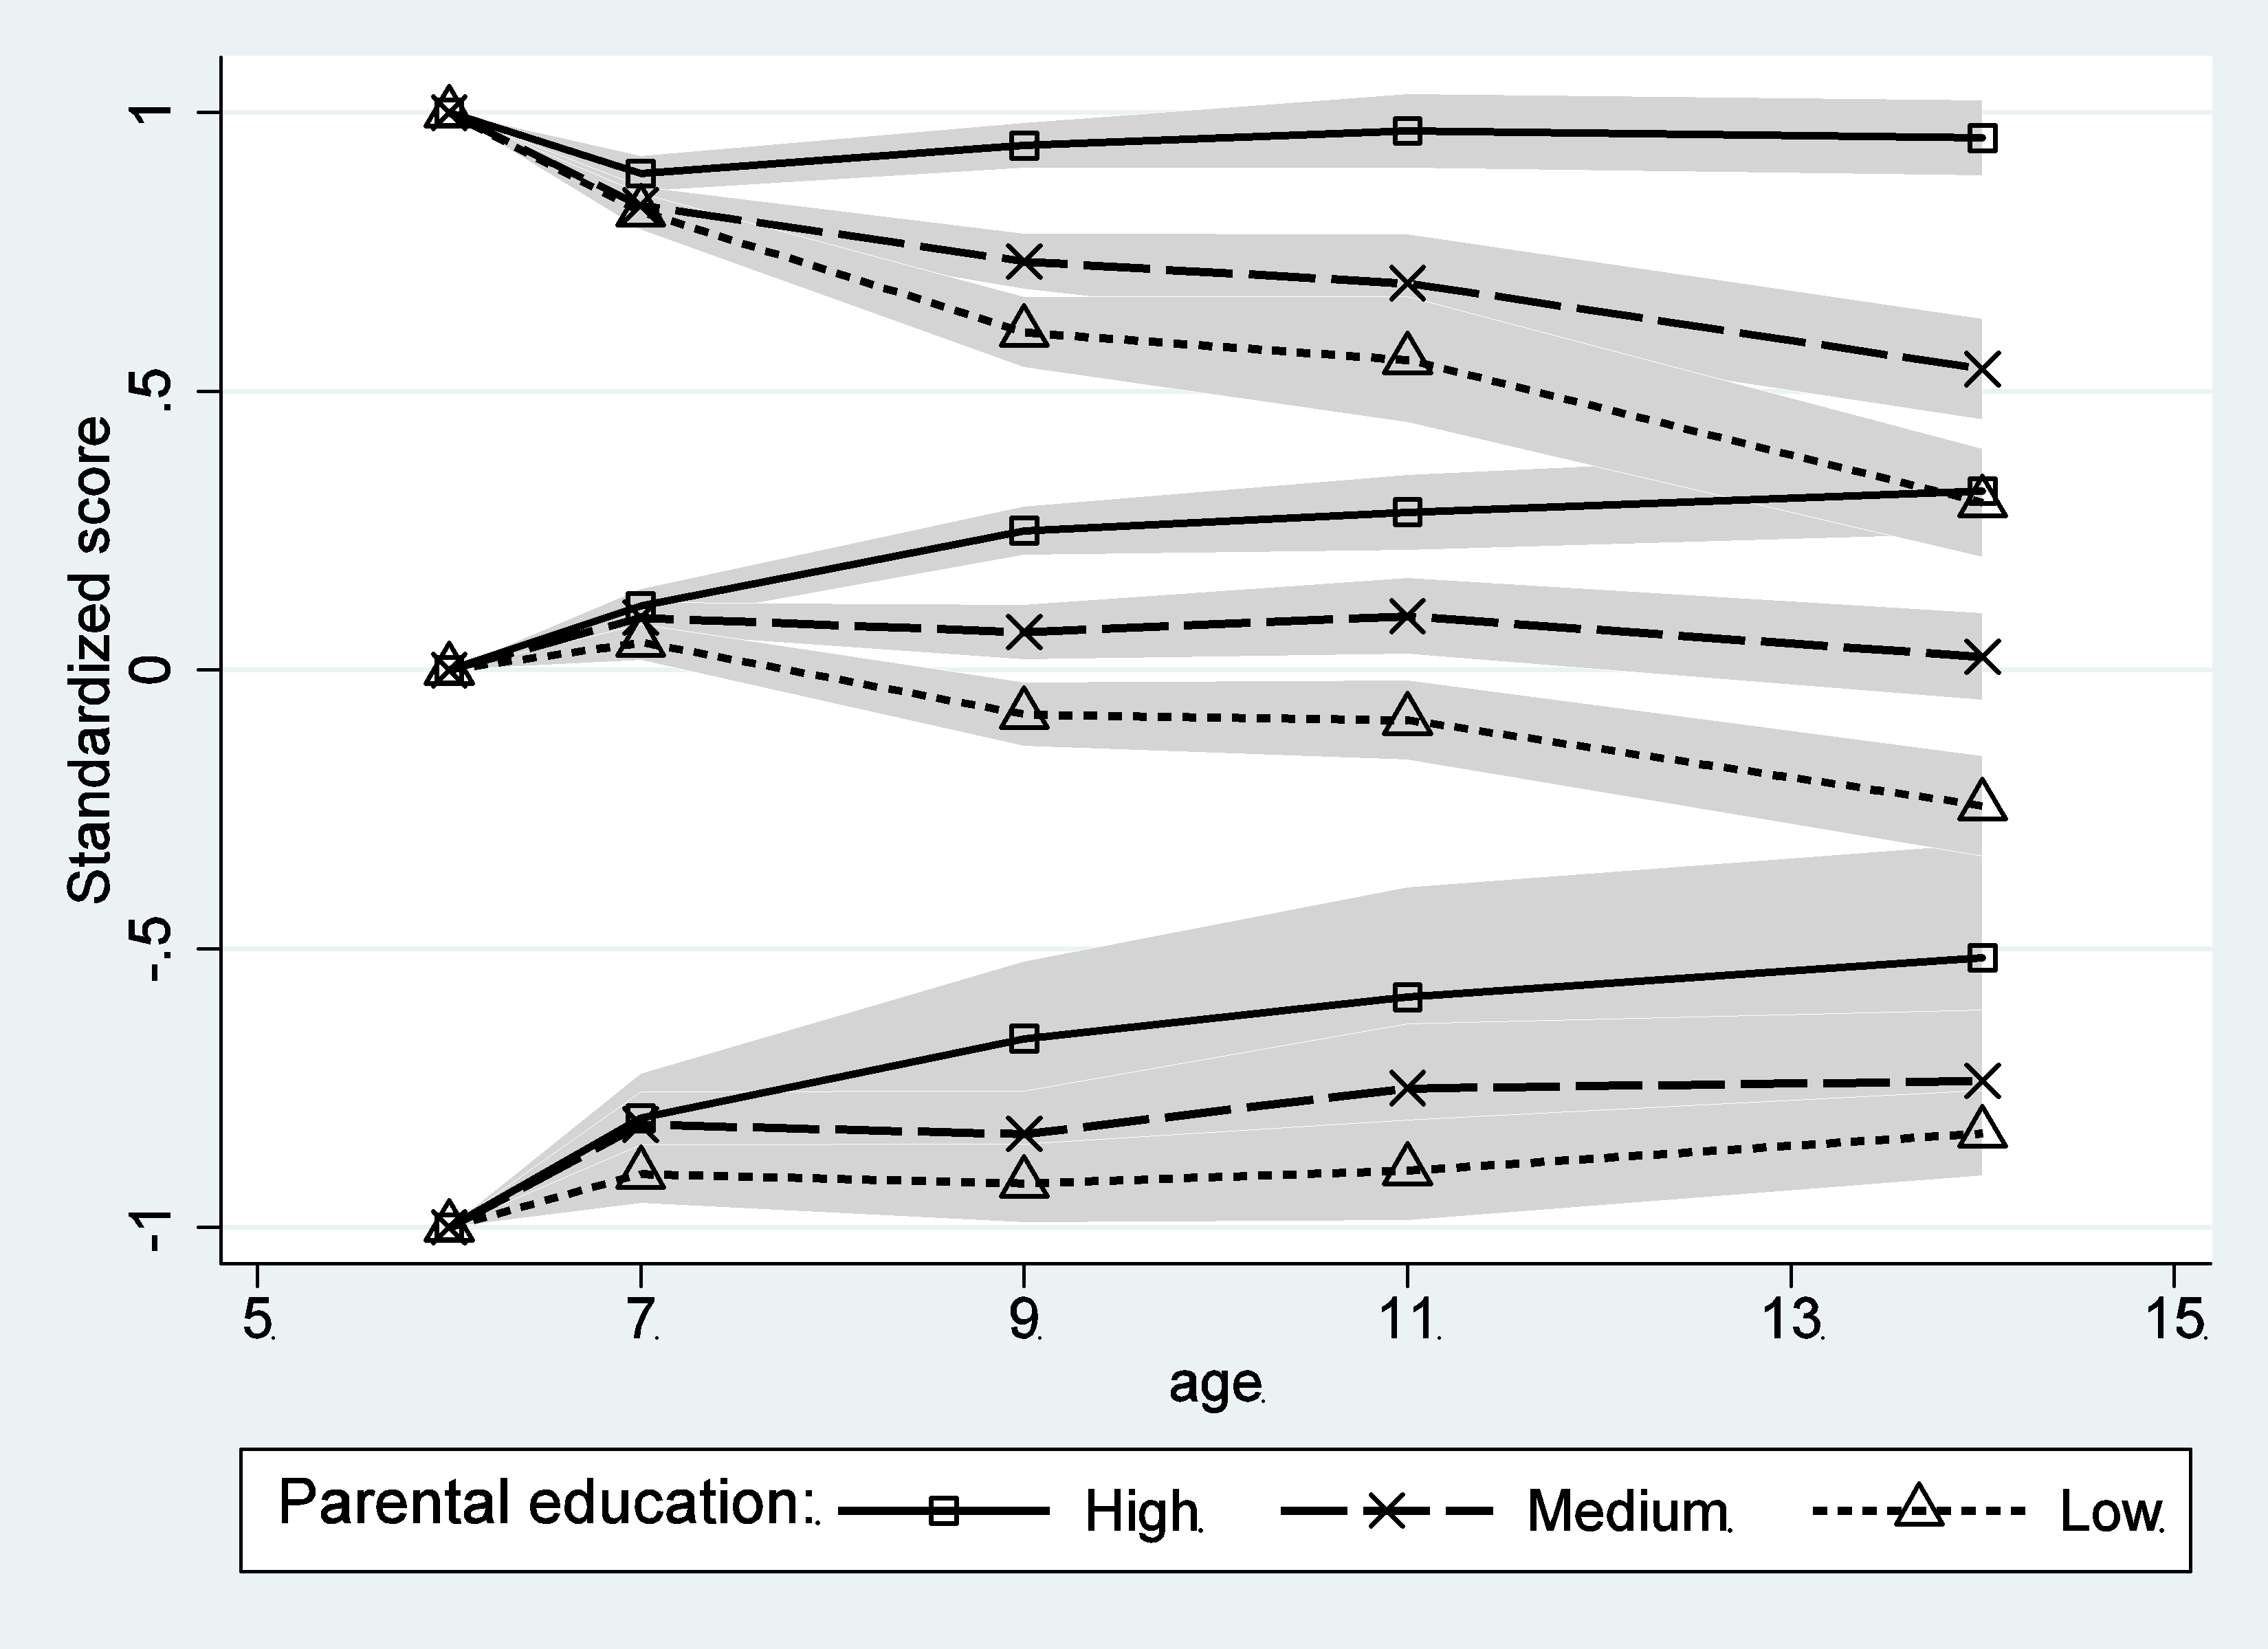
The graph above details the results for reading tests from age five to 14 in the US (similar patterns are observed for the UK). Children are first split into three groups: high attaining (the top lines in the graph), average attaining (the middle lines) and low attaining (the bottom lines) at age five. The test score results here are presented in standard deviations, a measure of how far they are from the mean test results of the children.
The researchers then tracked progress over time for these three groups but also distinguished the pupils by their social background. Pupils were classified as low (parents with a high school education or less), medium (at least one parent with some college), or high (at least one parent with a college degree or more).
What is striking is that there is a consistent trend for all attainers – high, average or low. Children from poorly educated homes (represented by the triangles) who started out with high test scores lose ground relative to their high attaining peers from highly educated homes (represented by the squares). Children from highly educated homes meanwhile who began with the low reading score went a long way toward recovering by eighth grade (age 14). Children from poorly educated homes with the same initial low score remained at the bottom of the class.
Why is the graph so important? Firstly, it makes it clear that the challenges faced by children from lowly educated homes are not “all over” by school entry. Secondly, it highlights that despite the huge impact of the pre-school years, many children from lowly educated homes are still doing well academically when they start school. Sadly they then fall behind as they progress through school.
The academics estimate that around half of the widening of the achievement gap is due to the quality of schools attended by children. The implications are clear: addressing social mobility requires efforts throughout the fledging and formative years of all children and outside as well as inside the school gates. Amid speculation that the government in England is considering focusing pupil premium funds on low achievers only, this evidence points firmly against this. The pupil premium needs to be used for high attaining poorer pupils as well as those doing less well in academic tests.