Press Releases
Congratulations to the young people who received their results this week, alongside the school staff and parents who supported them.
Their year group had been through a lot. From the COVID-19 pandemic causing disruption throughout their time in Year 9 and Year 10, through to more recent challenges, including the ongoing cost of living crisis, industrial action from teachers and the RAAC building crisis.
Throughout it has too often been young people from poorer homes hit the hardest, for example being less able to work remotely when schools have had to close. And of course, the poorest families have been those hit hardest by soaring prices.
Now this group of students have reached their Level 3 assessments, from A levels to T levels and BTECs, crucial results in determining their next steps in education or the workplace.
What did we learn from this week’s Level 3 results day? And what can this week’s data tell us about educational inequalities and regional disparities in opportunities?
A Level results
Grade distribution
Initially after the pandemic and the resultant exam disruption, there was a period of grade inflation for A levels. The regulatory body Ofqual has looked to bring grades back down to pre-pandemic levels. Last year they fell short of doing so, so this is the second year that’s been billed as a “return to normality” post pandemic.
Overall, the grade distribution this year has stayed broadly similar to 2023, but still looks slightly different from the norm pre-pandemic.
The proportion of A level grades at A and A* now stands at 27.8%, compared to 27.2% in 2023, a slight rise of 0.6 percentage points (data for England, Wales and NI). This is still above the 25.4% of 2019. Numbers of students receiving Cs and Ds still also remains lower than rates seen pre-pandemic.
Regional and school type inequalities
The proportion of students gaining A and above has risen this year in all regions, but substantial regional gaps within England remain. The East Midlands and the North East have the lowest rates of top grades, whereas London, the South East and East of England are far ahead. The gap between highest and lowest region for top grades has grown from 7.3pp in 2019 (between the South East and East Midlands) to 8.8pp today (between London and the East Midlands).
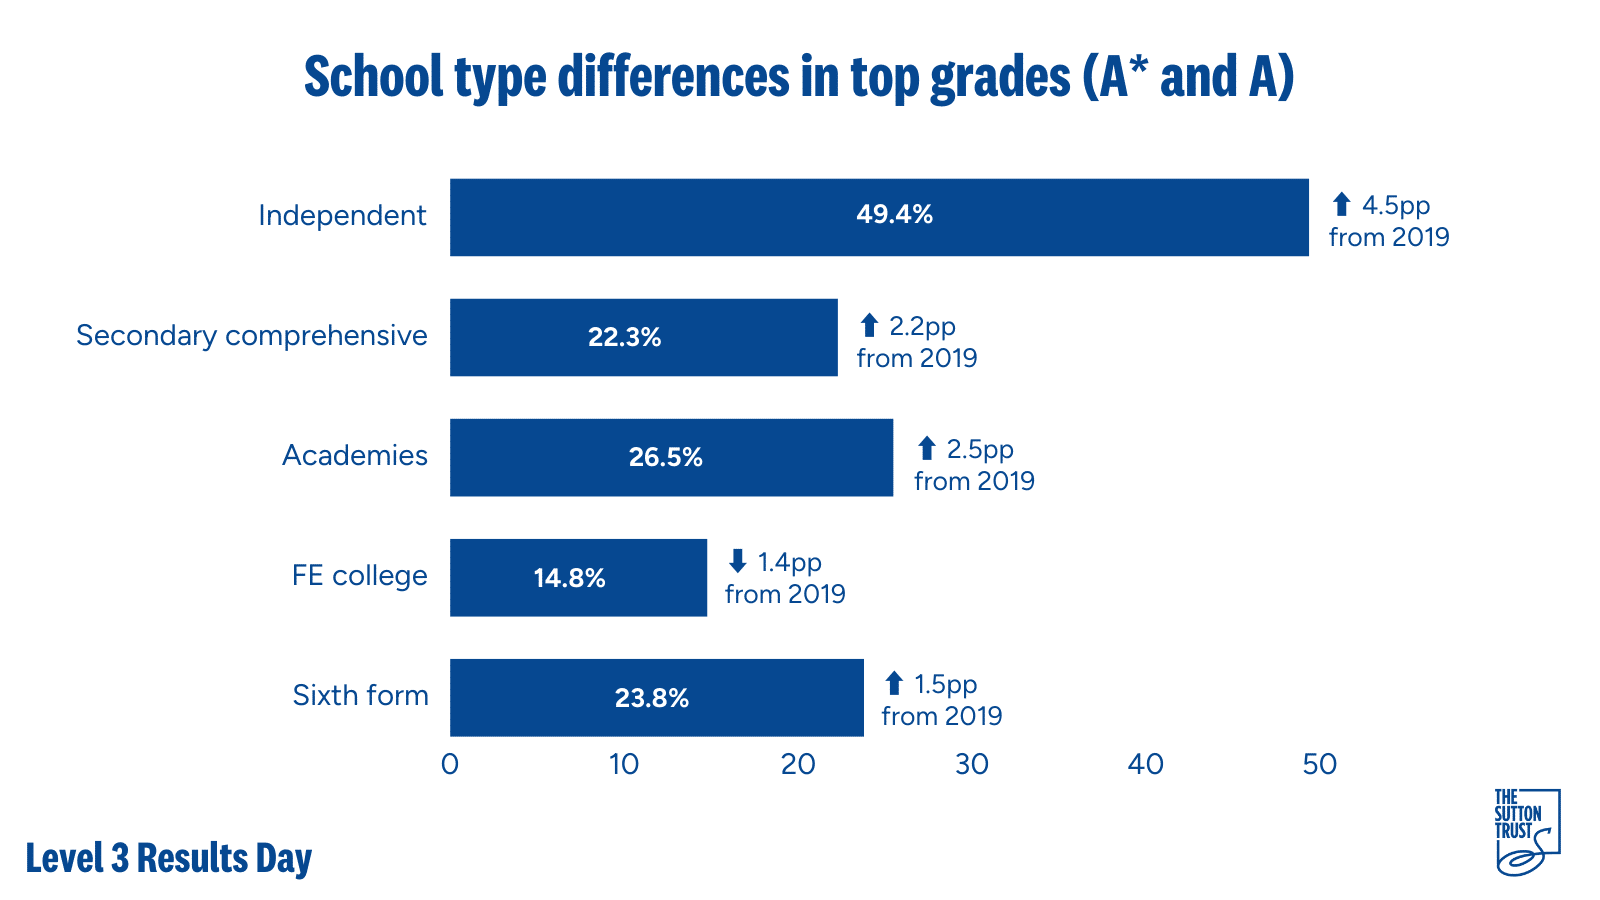
The gap between state and private schools has also continued to widen since 2019. A*/A grades at independent schools are up by 4.5 percentage points from 2019, to 49.4%, while at comprehensives the increase was only 2.2 percentage points (up to 22.3%), and at academies only 2.5 percentage points (up to 26.5%).
University access
The 18-year-old university entry rate in England has increased from 30.4% in 2023 to 31.7%, still down on the high of 34.1% in 2021. It is however still higher than the pre-pandemic rate of 28.1% in 2019.
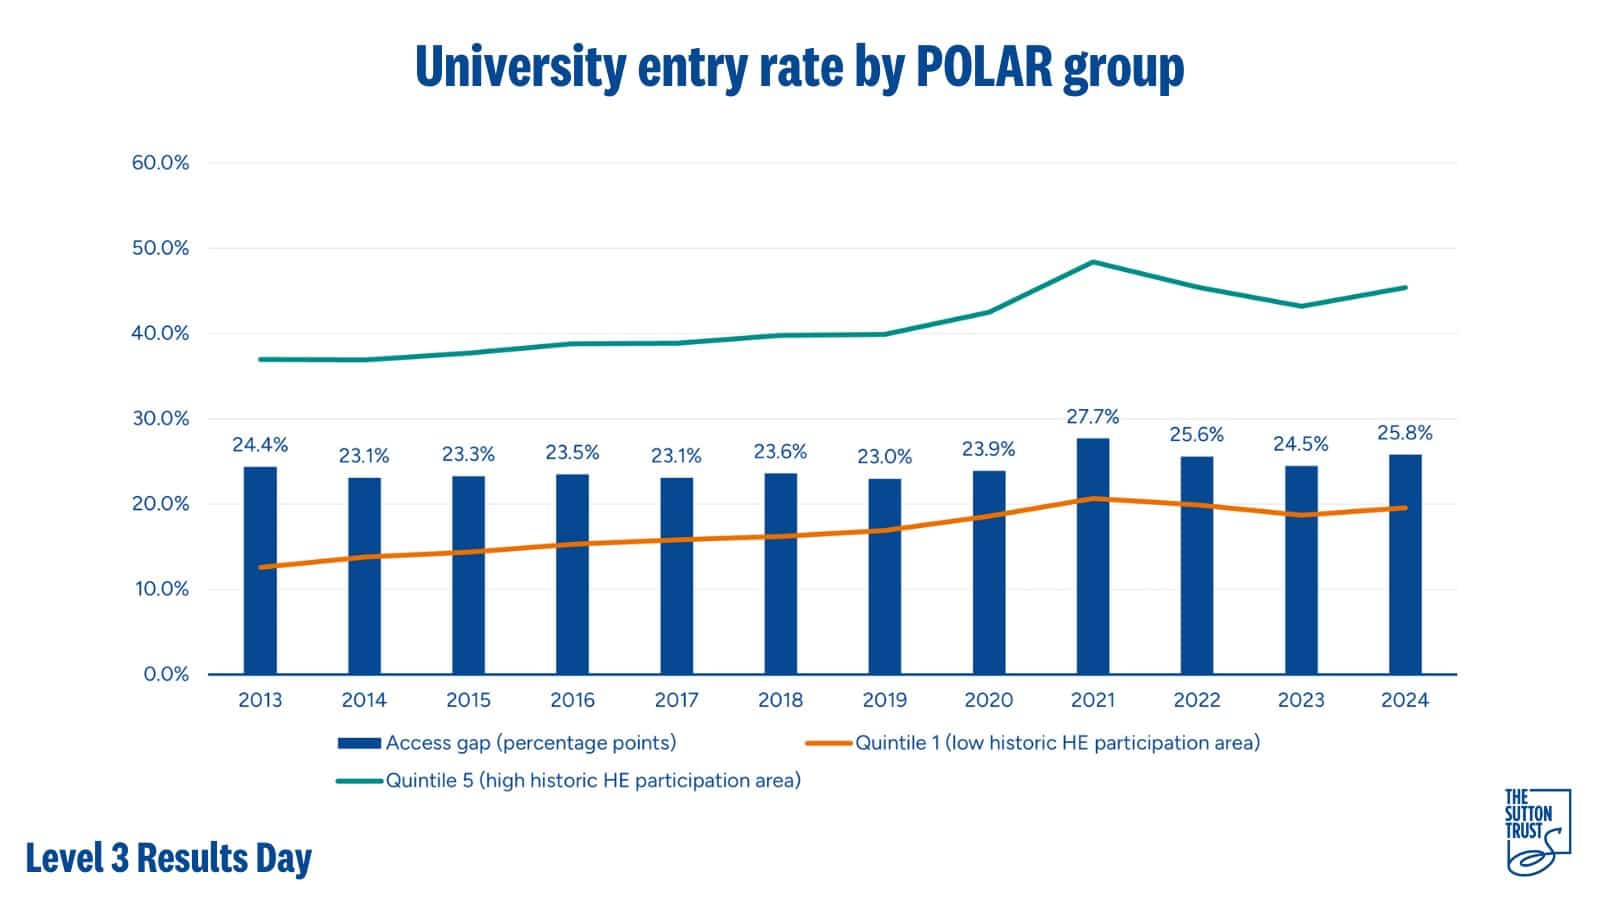
Entry rates have increased for young people from areas with historically low and historically high rates of participation in HE (the POLAR measure). However, as shown on the chart below, the gap in participation between these groups has now widened to 25.8pp. This means that other than during the pandemic (when the gap reached a high of 27.7pp), the gap is now at its widest since 2013.
What next?
Gaps in attainment between students from richer and poorer homes, and between different regions, are stark. This is a national challenge, and one which requires a national strategy to tackle inequalities and close the gap – as highlighted in our recently published roadmap for the next government.
Key policies to help close the gap include increasing Pupil Premium Funding, extending the Pupil Premium to post-16, and re-introducing the National Tutoring Programme with ringfenced funding (an evidence-backed intervention which has huge potential to help narrow the attainment gap, but which has not been renewed by government). However, the education system alone cannot eradicate the attainment gap. Any strategy must also include a plan to reduce and ultimately to end child poverty in the UK.
And universities also have a part to play. There should be an increase in the use and generosity of contextual offers – offers which take into account the circumstances in which grades were achieved.
We must do better, and give every student an equal chance at success.


