Opinion
Sir Peter Lampl, Founder and Chairman of the Sutton Trust and Chairman of the Education Endowment Foundation, said:
“Today’s results mark a major milestone in the lives of the Covid generation, who have faced huge disruption to their education in recent years. All youngsters receiving their results today should be proud of their achievements in the face of major challenges.
“The overall picture today is one of growing disparity between the most and least well off young people. There are significant regional differences in attainment, with top grades falling most in the North East while they have increased most in London and the South East, in line with patterns of regional prosperity. Likewise, the gap in those achieving top grades has widened between those at independent and state schools.
“Comparing this year’s university acceptances to pre-pandemic levels in 2019, the gap between the most and least deprived pupils has widened and is now at levels last seen a decade ago. However, it has narrowed slightly since last year.
“The large increase seen in university acceptances for students eligible for free school meals is in line with the huge jump in FSM eligibility since 2019, as more and more families have fallen into poverty during the pandemic and cost of living crisis.”
Sutton Trust analysis of today’s data:
A LEVEL RESULTS
- Overall: The proportion of A level grades at A and A* has again fallen, from 36.4% in 2022, to 27.2% in 2023, a fall of 9.2 percentage points (data for England, Wales and NI). This is still above the 25.4% of 2019, in a year where Ofqual had aimed to return to pre-pandemic grading levels. In comparison, lower grades have fallen more: overall grades of E and above are slightly below the figure in 2019 (97.3% compared to 97.6%).
- Geography: Regional gaps within England have widened since 2019. The proportion of students gaining A and above has fallen the most in the North East (down from 23% to 22%, a fall of 1pp), also falling slightly in Yorkshire and the Humber (down -0.2 from 23.2% to 23%), but has increased the most in London (from 26.9% to 30%, up 3.1pp) and the South East (from 28.3% to 30.3%, up 2pp).
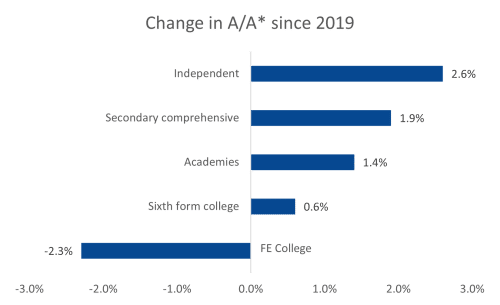
- School type: The gap between state and private schools has also widened since 2019, A*/A grades at independent schools are up by almost 3 percentage points to 47.4%, while at academies and comprehensives they are up by less than 1.5 percentage points (at 25.4% and 22% respectively). At FE colleges A grades are down by more than 2 percentage points since 2019, at 14.2%.
UNIVERSITY ACCESS
- Overall: 230,600 18-year olds have been accepted to university across England, Scotland, Wales and Northern Ireland, a slight decrease on the figure last year (which was 238,090), but an increase on numbers pre-pandemic. The 18 year old entry rate in England has fallen from 32.5% to 30.6%, from a high of 34.7% in 2021. It is still higher than the pre-pandemic rate of 28.5% in 2019.
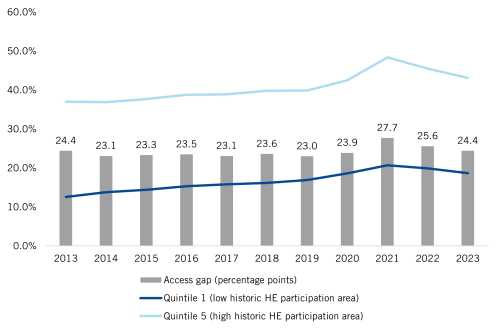
- Under-represented areas: Entry rates in all POLAR groups (historic levels of HE participation) are down this year, but remain higher than 2019. The gap in participation between the most under-represented areas and the least has closed slightly since last year, currently at 24.4pp, down from 25.6pp in 2022, but still higher than the 23pp gap in 2019 – and is as high as the gap was back in 2013 (24.4pp).
- Selective universities: Last year, after several years of expansion, acceptances at higher tariff universities fell. The share of acceptances at higher tariff universities stayed at a similar level this year (40.1% of 18 year old acceptances vs 39.98% in 2022), with slightly lower numbers of students accepted (101,560 18 year olds this year, compared to 104,430 in 2022, and a lower level of 86,420 in 2019).
- Students eligible for Free School Meals: While it has been reported that the number of FSM students accepted to university has increased by 60% since 2019, the number of students eligible for FSM in English secondary schools has increased by 76% between 2018/19 and 2022/23.

