Display the data for an individual constituency by clicking within the boundary.
You can browse the % of pupils on FSM who achieve passes in English and maths, the % of FSM pupils who complete a degree by age 22, and the % of FSM pupils who are in the top 20% of earners at age 28.
You can also see their ranking on our Opportunity Index. The colour of the constituency reflects their performance.
Hold down Ctrl + scroll to Zoom.
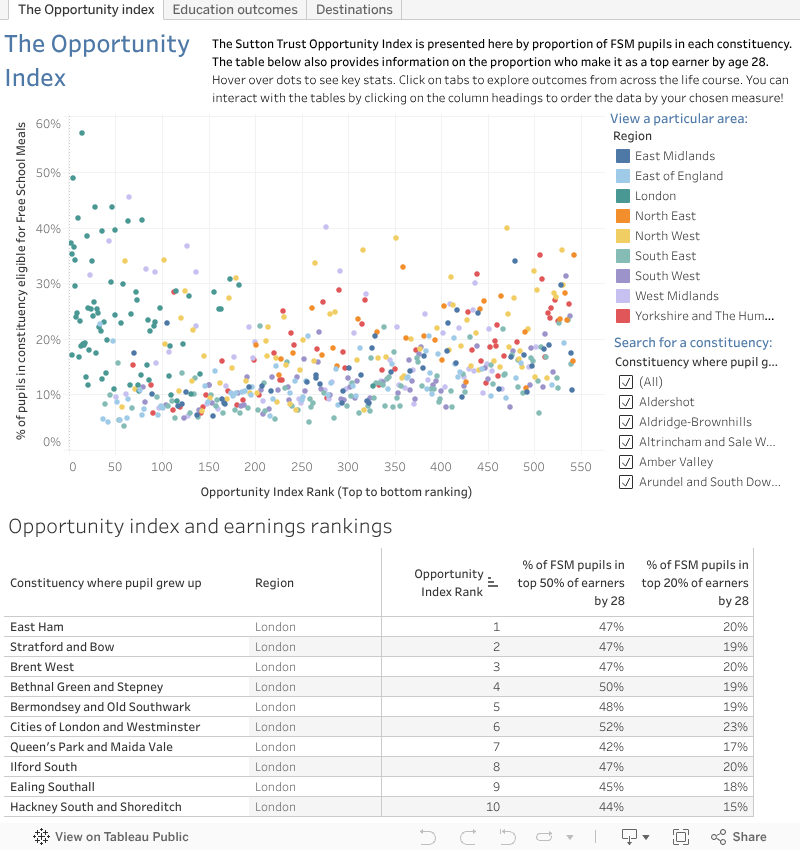
The interactive chart below presents the proportion of FSM pupils in each constituency. The table below also provides information on the proportion who make it as a top earner by age 28.
Hover over dots to see key stats and click across tabs to explore outcomes.
**Note: For best results this graph is better viewed on desktop rather than mobile**
Notes:
The Opportunity Index has been calculated by considering six key indicators of social mobility across the life course:
- School: Attainment 8.
- Post-16: A Level APS result.
- Post-16: Percentage in sustained education/employment after KS4.
- Post-18: Percentage with degree by age 22.
- Employment: average earning at age 28.
- Employment: Percentage in sustained employment at age 28.
You can read our analysis of the data in the full report.